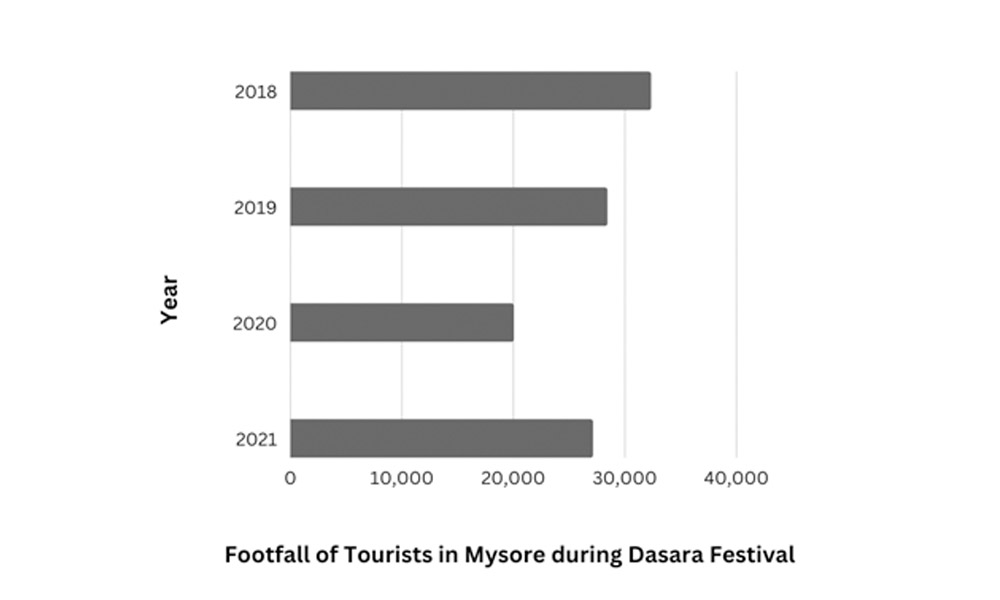
With the upcoming Mysore Dasara Festival, here is a data showing the number of tourists in Mysore every year during Dasara, on the day of Vijaydashami.
By Anuja Parashar
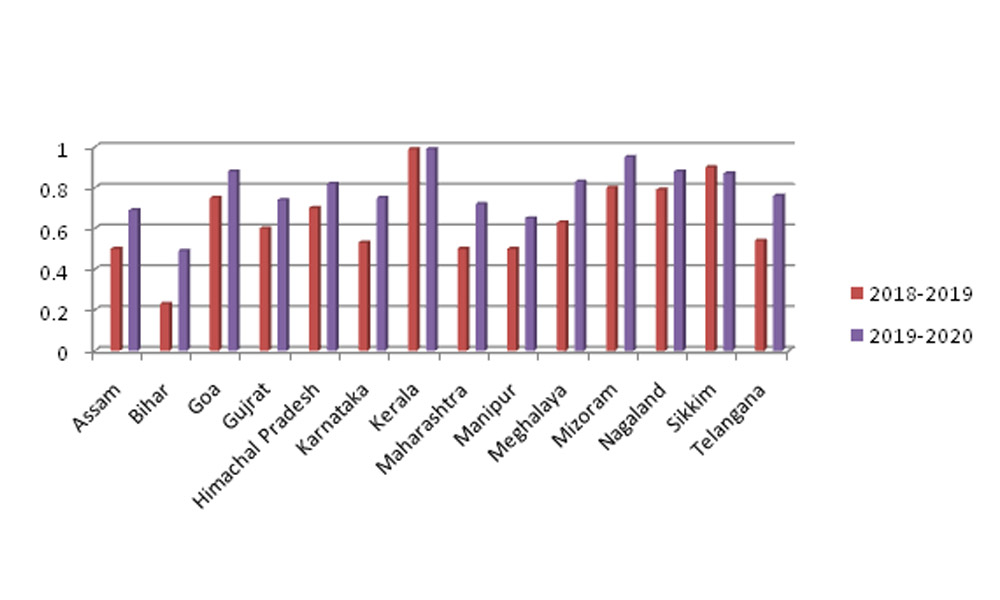
Data showing percentage of households with improved sanitation facility in different states.
By Taniva Singha Roy
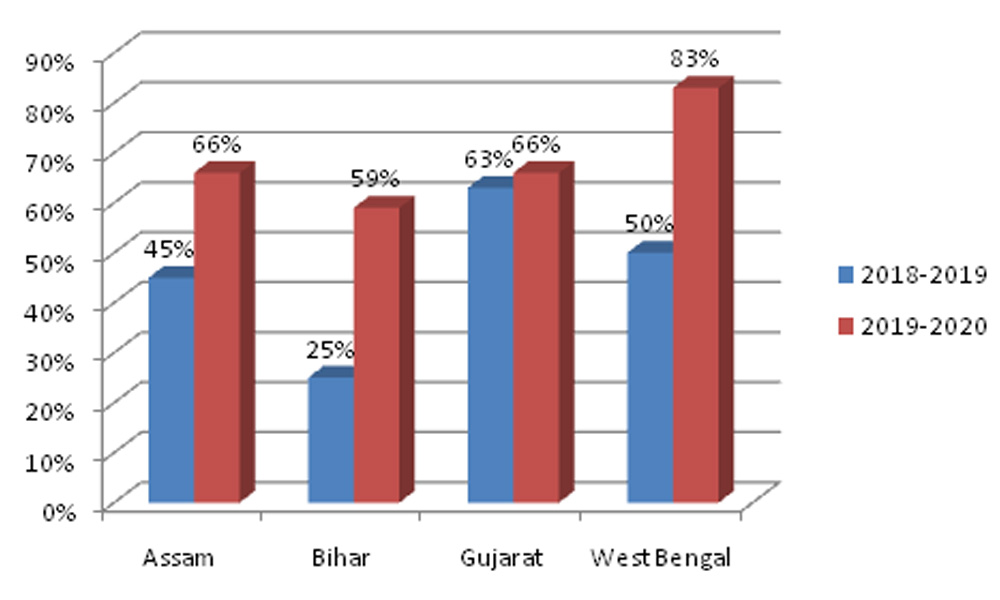
Data showing percentage of women using hygienic methods of protection during their menstrual period.
By Shreshtha Dutta
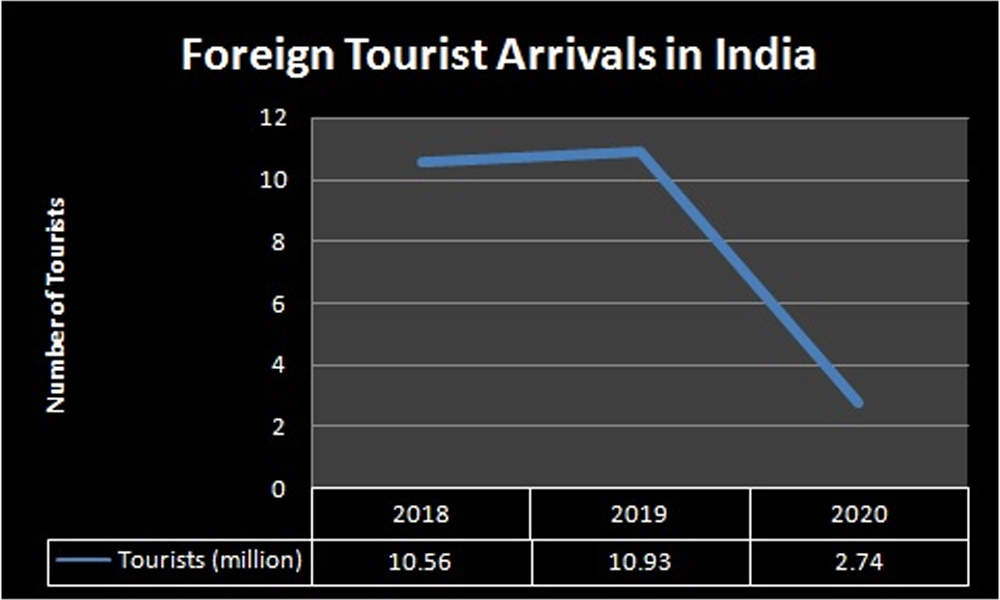
September 27 is marked as World Tourism Day. Graph compares the foreign tourist arrivals in India in the years 2018, 2019, and 2020.
By Mansi Arora
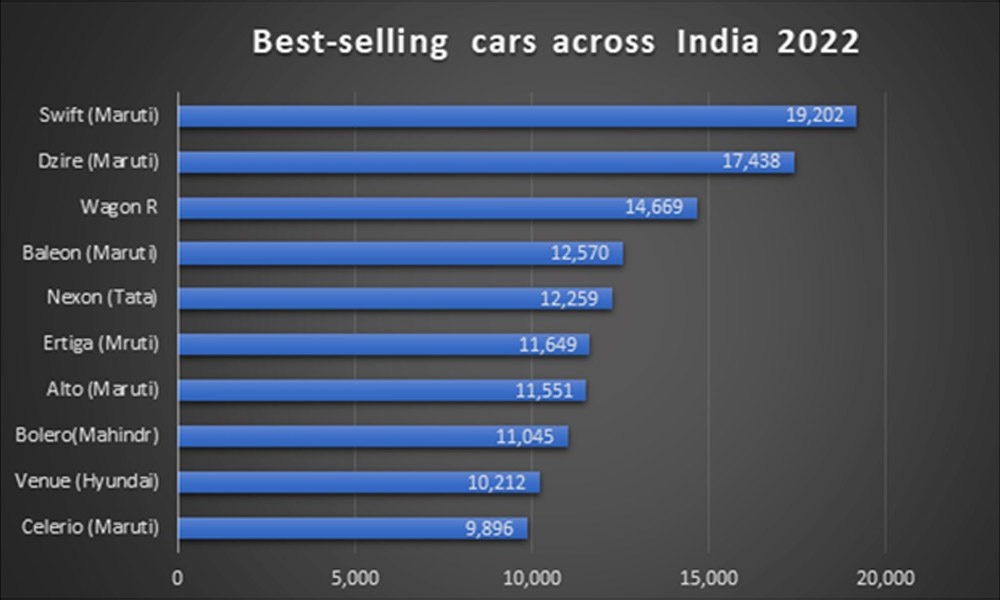
Best-selling cars across India as of February 2022, based on sales unit.
By Somanjali Das
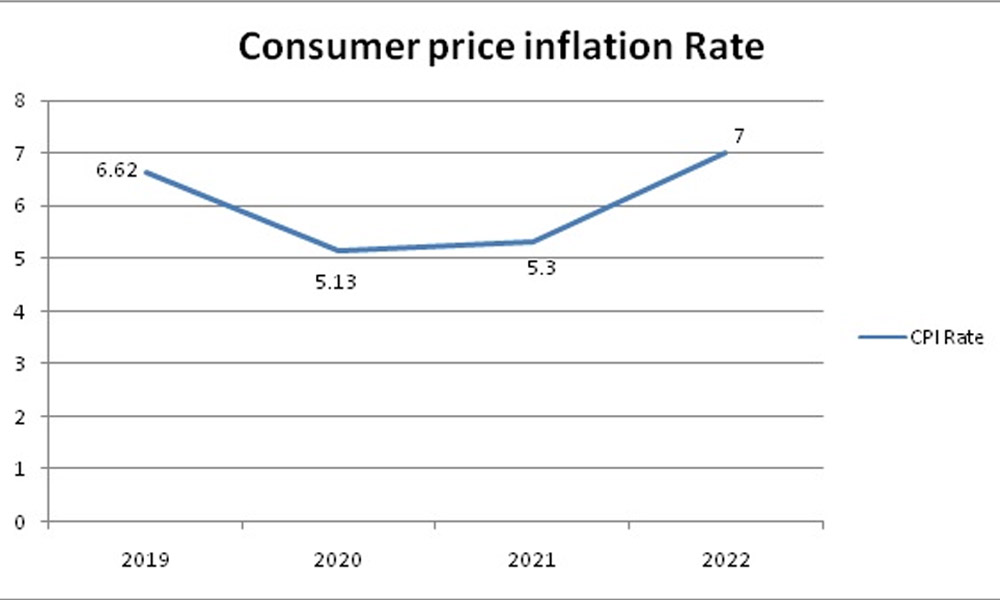
Trends in Consumer price inflation (CPI) from 2019-2022(till Sept). The graph shows the percentage of CPI over the last four years.
By Anupreksha Jain
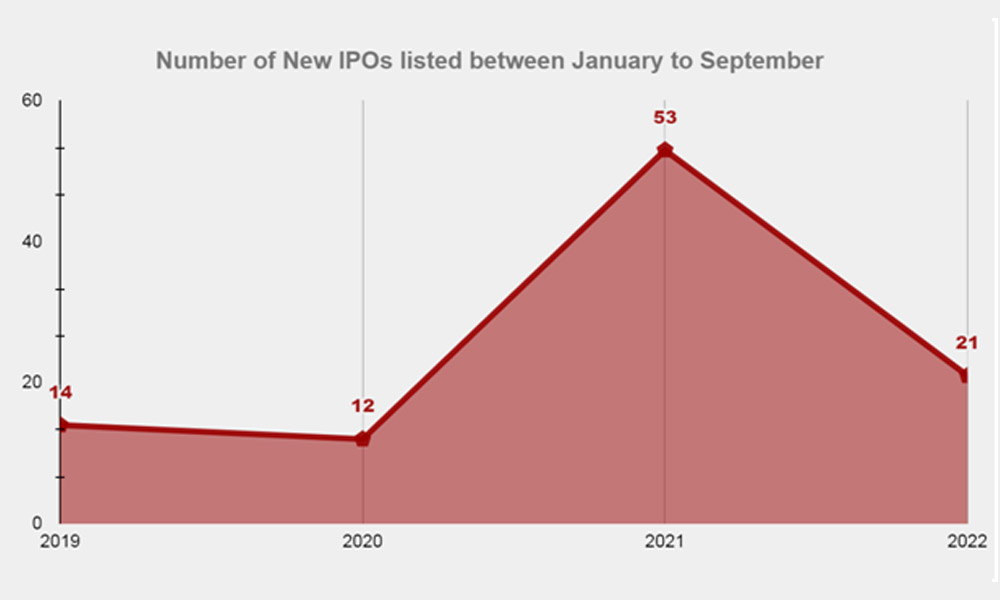
The number of new Initial Public Offerings listed in the stock market between January and September
By Harshita Meenaktshi
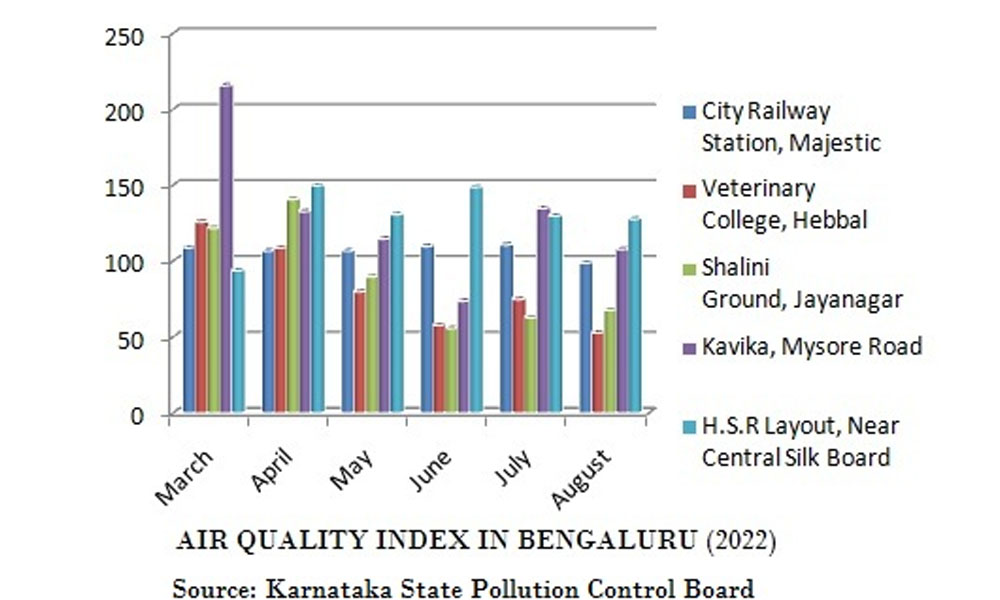
The infographic shows the air quality index values of Bengaluru from March to August 2022 where AQI is measured as Good (0-50), Satisfactory (51-100), Moderate (101-200) and Poor (201-300)
By Neha Soni
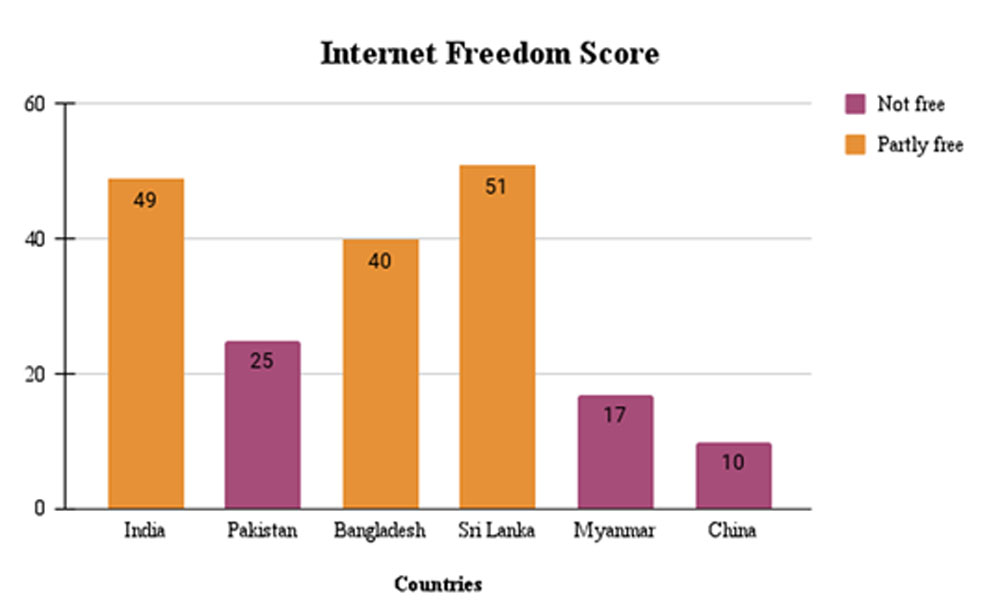
Internet Freedom Status of India and its neighbouring countries based on the fields of Obstacles to Access, Limits of Content and Violation of User Rights.
By Sneha Kumar
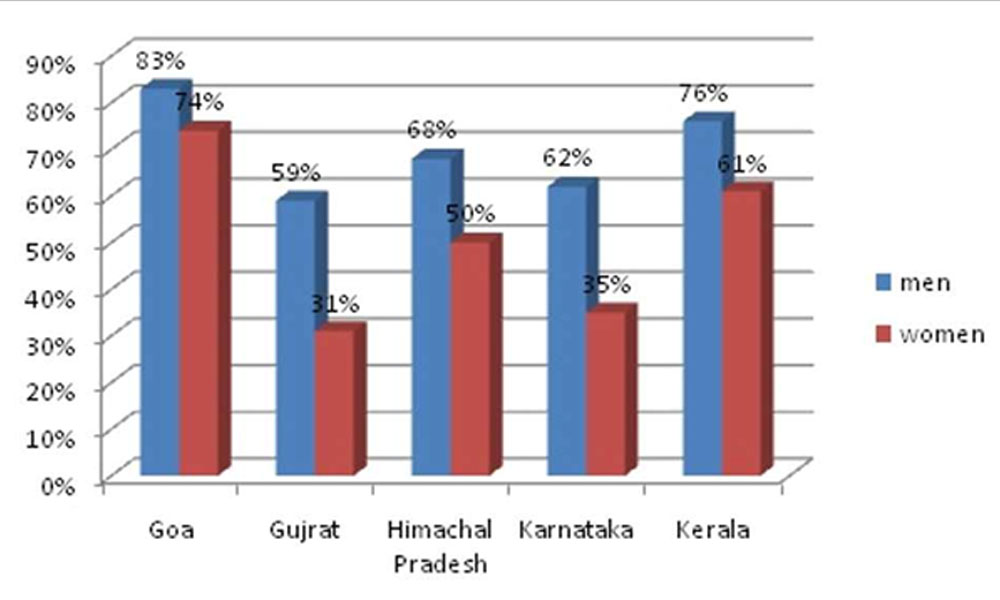
Percentage of men using internet as compared to women state wise in the year 2019-2020.
By Aakriti Srivastava
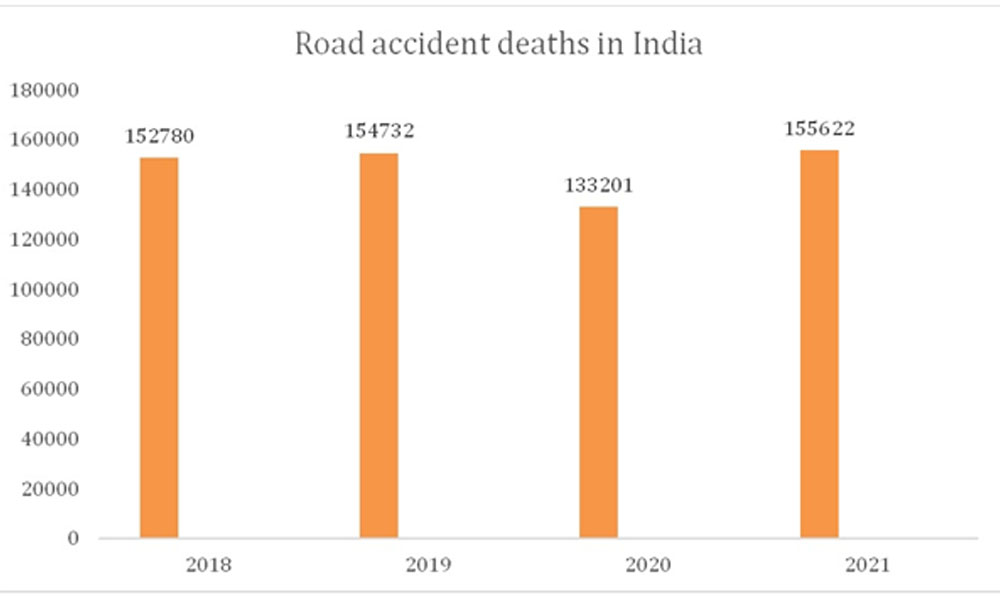
Last year the highest number of people lost their lives due to road accidents.
By Riya Roy Chowdhury
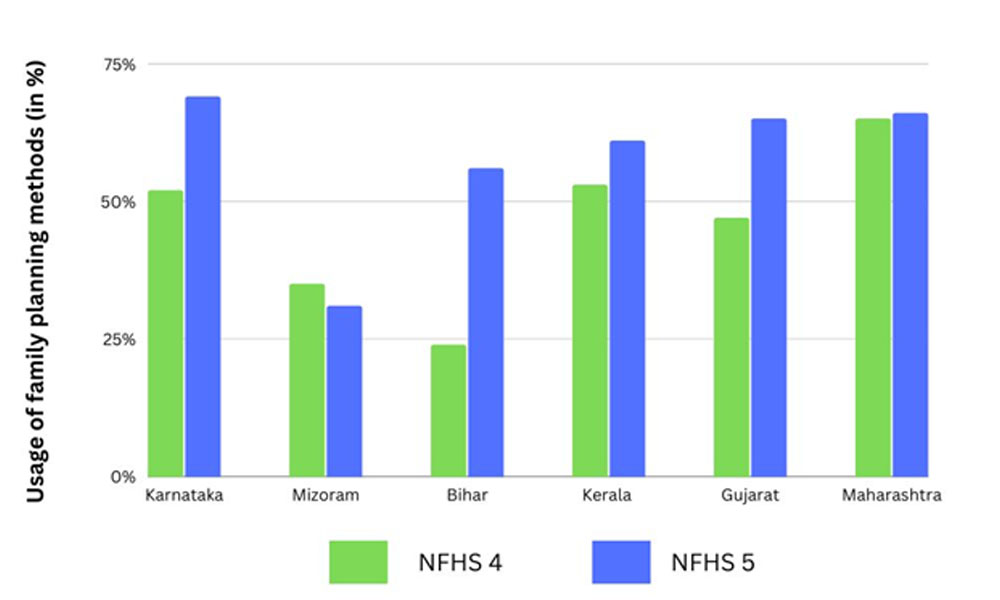
Statistics showing usage of family planning methods in India in NFHS 5 (2019-20) compared to NFHS 4 (2015-16)
By Anchal Verma
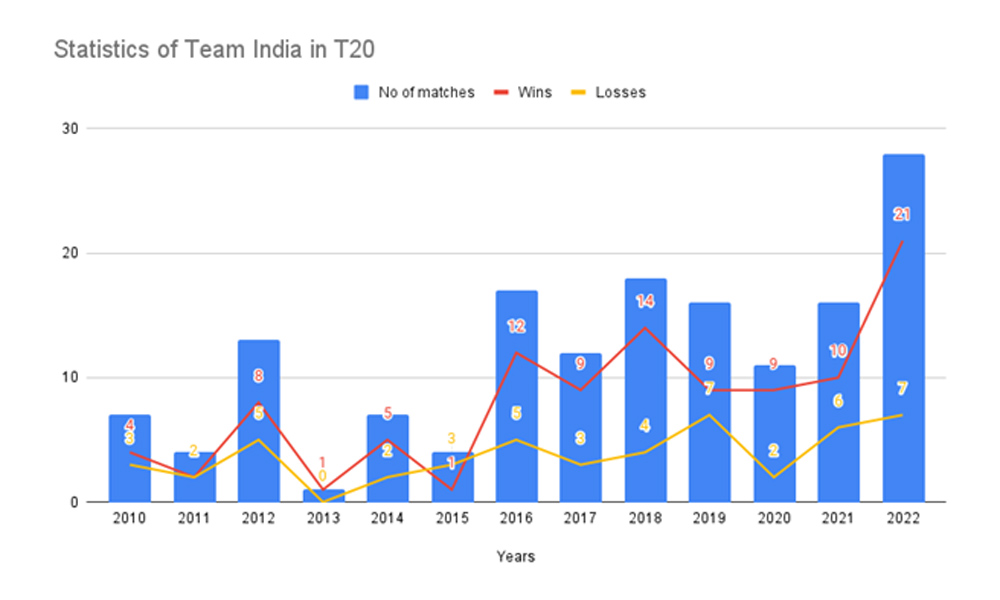
India played highest number of T20 matches in 2022 and also broke Pakistan’s record for the most T20 wins in a calendar year with 21 wins out of 28 matches so far in 2022.
By Dhananjay Gautam
A look at how the INR and GBP prices have fallen when compared to the dollar in 2022.
By Anas Ali


